

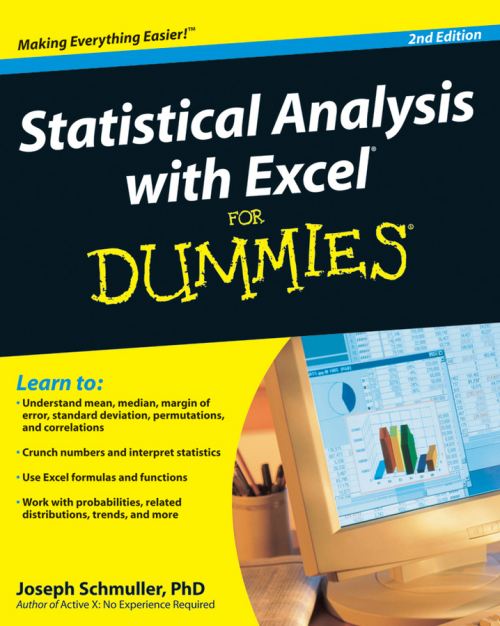
You too can understand the statistics of life, even if you?re math–challenged!
What do you need to calculate? Manufacturing output? A curve for test scores? Sports stats? You and Excel can do it, and this non–intimidating guide shows you how. It demystifies the different types of statistics, how Excel functions and formulas work, the meaning of means and medians, how to interpret your figures, and more in plain English.
Excel tricks find out what?s built into the program to help you work with Excel formulas
Playing with worksheets get acquainted with the worksheet functions for each step
Graphic displays present your data as pie graphs, bar graphs, line graphs, or scatter plots
What?s normal? understand normal distribution and probability
Hyping hypotheses learn to use hypothesis testing with means and variables
When regression is progress discover when and how to use regression for forecasting
What are the odds work with probability, random variables, and binomial distribution
Open the book and find:
The difference between descriptive and inferential statistics
Why graphs are good
How to measure variations
What standard scores are and why they?re used
When to use two–sample hypothesis testing
How to use correlations
Different ways of working with probability
| ISBN: | 9780470454060 |
| Publication date: | 22nd May 2009 |
| Author: | Joseph Schmuller |
| Publisher: | John Wiley & Sons, Inc. an imprint of Wiley |
| Format: | Paperback |
| Pagination: | 480 pages |
| Genres: |
Mathematics Business applications |
You too can understand the statistics of life, even if you?re math–challenged! What do you need to calculate?
Statistical Analysis With Excel for Dummies features in the following genres: Mathematics, Business applications
Paperback, Ebook. Not Available.
Statistical Analysis With Excel for Dummies was written by Joseph Schmuller and published by John Wiley & Sons, Inc. an imprint of Wiley
Statistical Analysis With Excel for Dummies has 480 pages