

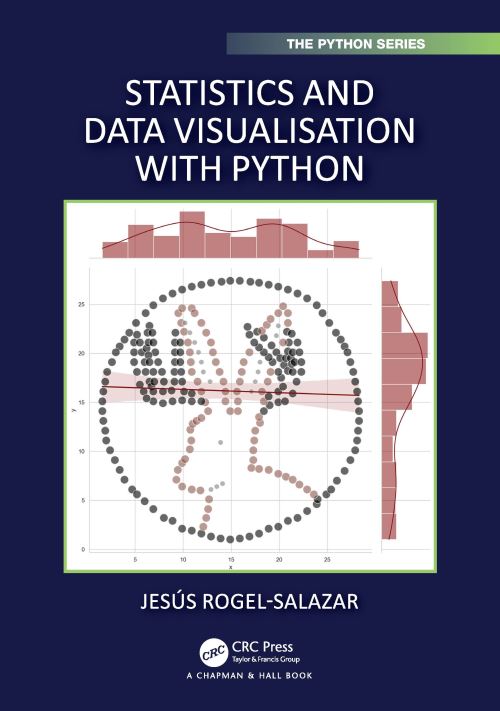
This book is intended to serve as a bridge in statistics for graduates and business practitioners interested in using their skills in the area of data science and analytics as well as statistical analysis in general. On the one hand, the book is intended to be a refresher for readers who have taken some courses in statistics, but who have not necessarily used it in their day-to-day work. On the other hand, the material can be suitable for readers interested in the subject as a first encounter with statistical work in Python. Statistics and Data Visualisation with Python aims to build statistical knowledge from the ground up by enabling the reader to understand the ideas behind inferential statistics and begin to formulate hypotheses that form the foundations for the applications and algorithms in statistical analysis, business analytics, machine learning, and applied machine learning. This book begins with the basics of programming in Python and data analysis, to help construct a solid basis in statistical methods and hypothesis testing, which are useful in many modern applications.
| ISBN: | 9780367744519 |
| Publication date: | 31st January 2023 |
| Author: | Jesús RogelSalazar |
| Publisher: | Chapman & Hall/CRC an imprint of CRC Press |
| Format: | Paperback |
| Pagination: | 516 pages |
| Series: | Chapman & Hall/CRC the Python Series |
| Genres: |
Probability and statistics Information visualization Data science and analysis: general |
This book is intended to serve as a bridge in statistics for graduates and business practitioners interested in using their skills in the area of data science and analytics as well as statistical analysis in general. On the one hand, the book is intended to be a refresher for readers who have taken some courses in statistics, but who have not necessarily used it in their day-to-day work.
Statistics and Data Visualisation With Python features in the following genres: Probability and statistics, Information visualization, Data science and analysis: general
Paperback. £46.79, down from the £51.99 cover price. Not Available.
Statistics and Data Visualisation With Python was written by Jesús RogelSalazar and published by Chapman & Hall/CRC an imprint of CRC Press
Statistics and Data Visualisation With Python has 516 pages
Yes it is part of Chapman & Hall/CRC the Python Series series
£46.79, reduced from £51.99. Not Available.